RでFashion MNISTメモ シンプルな多層NN
RでFashion MNISTの続き。前回はデータの可視化で留まっていたので、今回はチュートリアルに載っている基本的な全結合モデルでいろいろと比較を行ったメモ。
データ準備
はじめに、array形式からNNに入力できるようなmatrix形式に変換したデータを準備します。
library(keras)
library(tidyverse)

fashion_mnist <- dataset_fashion_mnist()
c(c(train_images, train_labels), c(test_images, test_labels)) %<-% fashion_mnist

train_images = array_reshape(train_images, c(nrow(train_images), 784)) / 255
test_images = array_reshape(test_images, c(nrow(test_images), 784)) / 255
train_labels = to_categorical(train_labels, 10)
test_labels = to_categorical(test_labels, 10)
ここで、変換後の次元を確認しておきます。
> dim(train_images)
#> [1] 60000   784
> dim(test_image)
#> [1] 10000   784
> dim(train_labels)
#> [1] 60000    10
> dim(test_labels)
#> [1] 10000    10
モデルとしては、入力784のNNを作成することになります。
モデル定義
5つのモデルを定義していきます。
model1 <- keras_model_sequential() %>%
  layer_dense(units = 128, activation = "relu", input_shape = c(784)) %>%
  layer_dense(units = 10, activation = "softmax")

model2 <- keras_model_sequential() %>%
  layer_dense(units = 256, activation = "relu", input_shape = c(784)) %>%
  layer_dense(units = 10, activation = "softmax")

model3 <- keras_model_sequential() %>%
  layer_dense(units = 256, activation = "relu", input_shape = c(784)) %>%
  layer_dense(units = 128, activation = "relu") %>%
  layer_dense(units = 10, activation = "softmax")

model4 <- keras_model_sequential() %>%
  layer_dense(units = 256, activation = "relu", input_shape = c(784)) %>%
  layer_dropout(rate = 0.4) %>%
  layer_dense(units = 128, activation = "relu") %>%
  layer_dropout(rate = 0.3) %>%
  layer_dense(units = 10, activation = "softmax")

model5 <- keras_model_sequential() %>%
  layer_dense(units = 256, activation = "relu", input_shape = c(784),
              kernel_regularizer = regularizer_l2(l = 0.001)) %>%
  layer_dense(units = 128, activation = "relu",
              kernel_regularizer = regularizer_l2(l = 0.001)) %>%
  layer_dense(units = 10, activation = "softmax")
128ユニットと256ユニットの全結合層を一層持つモデル、128ユニットと256ユニットの全結合層を二層持つモデル、それにドロップアウトとL2正則化を加えたモデルを比較していきます。
ここでは、4番目だけモデルの詳細を確認します。
> model4
#> _______________________________________________________________
#> Layer (type)                Output Shape             Param #
#> ===============================================================
#> dense_8 (Dense)            (None, 256)              200960
#> _______________________________________________________________
#> dropout_1 (Dropout)         (None, 256)              0
#> _______________________________________________________________
#> dense_9 (Dense)            (None, 128)              32896
#> _______________________________________________________________
#> dropout_2 (Dropout)         (None, 128)              0
#> _______________________________________________________________
#> dense_10 (Dense)            (None, 10)               1290
#> ===============================================================
#> Total params: 235,146
#> Trainable params: 235,146
#> Non-trainable params: 0
#> _______________________________________________________________
それぞれのパラメータ数は、以下のようになっていることが確認できます。
> 784 * 256 + 256
#> [1] 200960
> 256 * 128 + 128
#> [1] 32896
> 128 * 10 + 10
#> [1] 1290
> 200960 + 32896 + 1290
#> [1] 235146
学習・検証
モデルのコンパイル、学習・検証、評価の一連の流れは同じで複数書くのは面倒なため、一つにまとめたfunctionを作成します。
fit_model <- function(model, epochs = 20, batch_size = 128, validation_split = 0.2) {
  model %>%
    compile(
      loss = "categorical_crossentropy",
      optimizer = optimizer_rmsprop(),
      metrics = c("accuracy")
    )

  history <- model %>%
    fit(train_images,
        train_labels,
        epochs = epochs,
        batch_size = batch_size,
        validation_split = validation_split)

  evaluate <- model %>%
    evaluate(test_images,
             test_labels)

  result <- list()
  result$model <- model
  result$history <- history
  result$evaluate <- evaluate
  result
}
ここでは横着して、損失や最適化器の種類などは固定としています。
あとはこの関数に定義したモデルを流します。
result_model1 <- fit_model(model1)
result_model2 <- fit_model(model2)
result_model3 <- fit_model(model3)
result_model4 <- fit_model(model4)
result_model5 <- fit_model(model5)
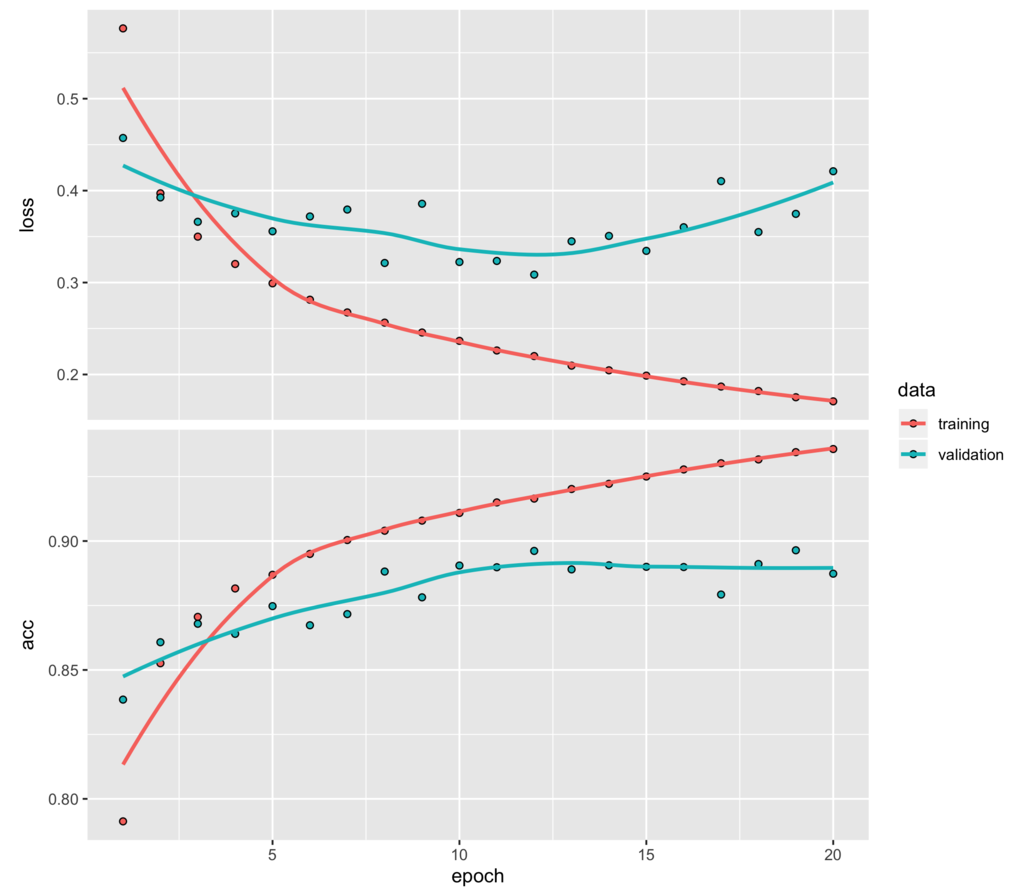
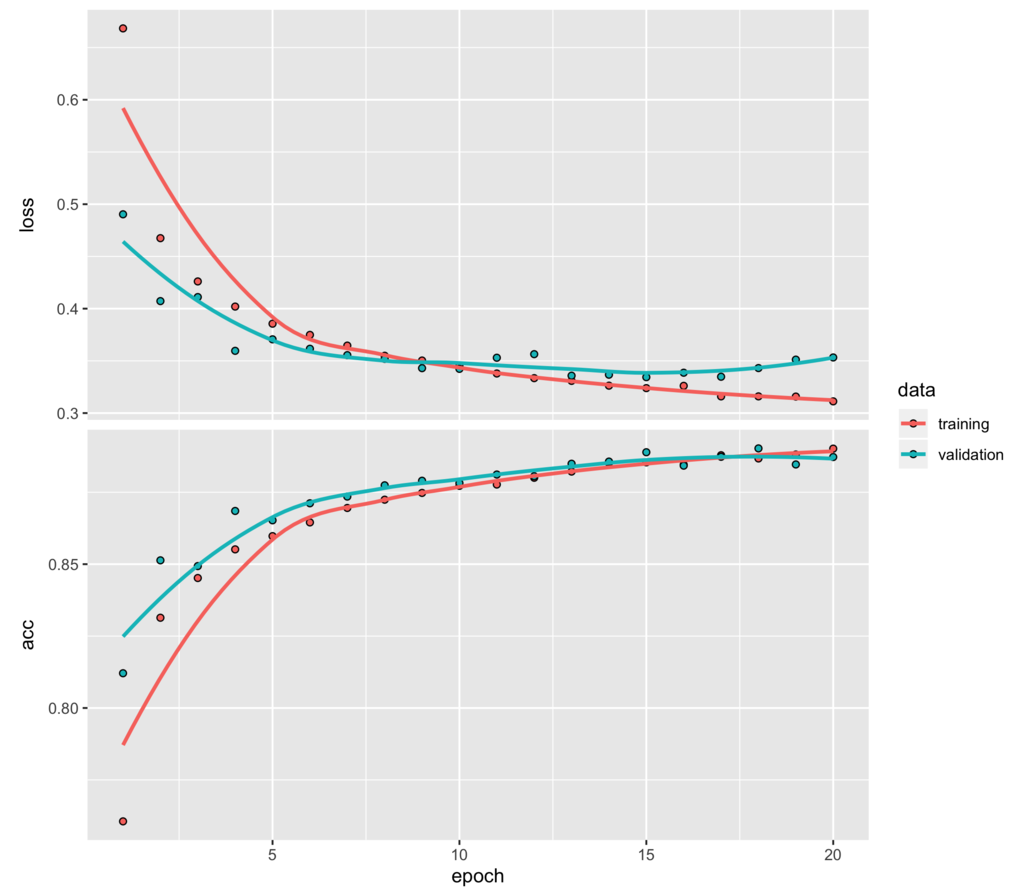
学習結果としてここでは、128ユニットと256ユニットの全結合層を二層持つモデルとそれにドロップアウトを加えたものの学習推移をプロットします。
plot(result_model3$history)

plot(result_model4$history)

上のドロップアウトを入れていない方は最初の数エポック学習しただけで、検証セットに対しては損失の改善が進まなくなり、早々に過学習が始まっていることが読み取れます。
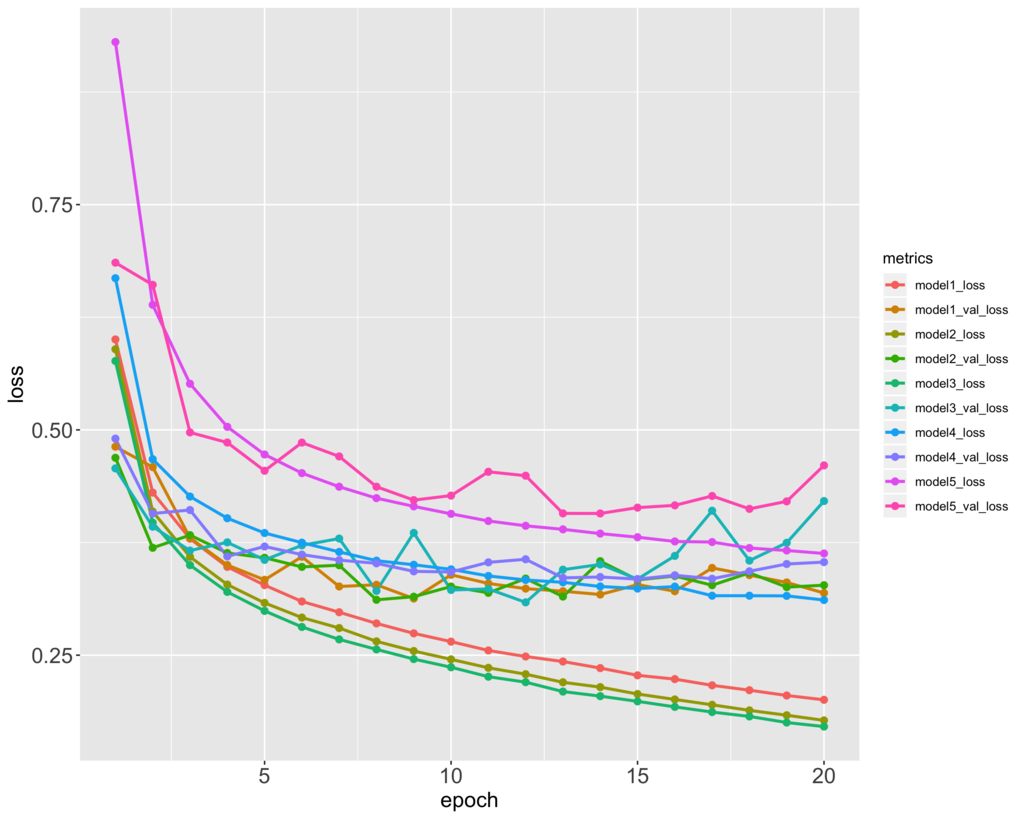
5つのモデルの訓練セットと検証セットの損失の推移をプロットすると以下のようになります。
metrics_loss_df <- data.frame(
  epoch = 1:20,
  model1_loss = result_model1$history$metrics$loss,
  model1_val_loss = result_model1$history$metrics$val_loss,
  model2_loss = result_model2$history$metrics$loss,
  model2_val_loss = result_model2$history$metrics$val_loss,
  model3_loss = result_model3$history$metrics$loss,
  model3_val_loss = result_model3$history$metrics$val_loss,
  model4_loss = result_model4$history$metrics$loss,
  model4_val_loss = result_model4$history$metrics$val_loss,
  model5_loss = result_model5$history$metrics$loss,
  model5_val_loss = result_model5$history$metrics$val_loss
)

metrics_loss_df %>%
  gather(metrics, loss, -epoch) %>%
  ggplot(aes(x = epoch, y = loss, colour = metrics)) +
  geom_line(size = 1) +
  geom_point(size = 2) +
  theme(axis.text = element_text(size = 15),
        axis.title = element_text(size = 15))

評価
テストセットに対する損失と精度は以下のようになります。
> result_model1$evaluate$loss
#> [1] 0.3818996
> result_model2$evaluate$loss
#> [1] 0.3967035
> result_model3$evaluate$loss
#> [1] 0.46188
> result_model4$evaluate$loss
#> [1] 0.3810765
> result_model5$evaluate$loss
#> [1] 0.4335504

> result_model1$evaluate$acc
#> [1] 0.8771
> result_model2$evaluate$acc
#> [1] 0.8799
> result_model3$evaluate$acc
#> [1] 0.878
> result_model4$evaluate$acc
#> [1] 0.8832
> result_model5$evaluate$acc
#> [1] 0.8704
ドロップアウトを加えたモデルが最も良い結果となりました。普通のMNISTに比べて精度を高めるのはなかなか難しいようです。
このモデルのファッションアイテムごとの正解率を確認します。
> predict_labels <- result_model4$model %>%
+     predict_classes(test_images)
> table(fashion_mnist$test$y, predict_labels)
#>     predict_labels
#>        0   1   2   3   4   5   6   7   8   9
#>    0 848   0  10  21   2   0 114   0   5   0
#>    1   2 966   1  24   2   0   5   0   0   0
#>    2  13   1 746  14 114   0 111   0   1   0
#>    3  25   2   5 914  16   0  35   0   3   0
#>    4   1   1  68  58 775   0  97   0   0   0
#>    5   0   0   0   0   0 963   0  25   2  10
#>    6 121   1  63  32  44   0 732   0   7   0
#>    7   0   0   0   0   0   9   0 974   0  17
#>    8   3   0   2   4   5   1  15   5 964   1
#>    9   0   0   0   0   0   6   1  43   0 950
> diag(table(fashion_mnist$test$y, predict_labels)) / table(fashion_mnist$test$y)
#>
#>     0     1     2     3     4     5     6     7     8     9
#> 0.848 0.966 0.746 0.914 0.775 0.963 0.732 0.974 0.964 0.950
前回のt-SNEの可視化で確認した通り、2のPulloverや4のCoat、 6のShirtなどは分類が難しいことがわかります。