ggplot2 軸表記を変更する
ggplot2で可視化したグラフを資料等で貼り付ける時に、様々な人のことを考えて軸の表記を変えたいという場合がある。 見やすさやさしさ以外は本質的には変わらないが、変更の仕方をたまに調べていることがあるためメモ。
利用ユーザ数が大変多い2つのウェブサイトがあり、そのユーザ数が時系列で記録されたようなデータがあるとする。
> library(tidyverse)
> library(lubridate)
> library(scales)
>
> set.seed(2345)
> log_tbl <- tibble(
+     log_date = rep(seq(ymd("20201201"), ymd("20201231"), by = "day"), 2),
+     site = c(rep("A", 31), rep("G", 31)),
+     uu = c(rpois(31, 777), rpois(31, 888)) * 1e05
+ )
数千万ユーザが毎日利用している状態を想定している。
> log_tbl
# A tibble: 62 x 3
   log_date   site        uu
   <date>     <chr>    <dbl>
 1 2020-12-01 A     74300000
 2 2020-12-02 A     72600000
 3 2020-12-03 A     78400000
 4 2020-12-04 A     77000000
 5 2020-12-05 A     76500000
 6 2020-12-06 A     77000000
 7 2020-12-07 A     77200000
 8 2020-12-08 A     83400000
 9 2020-12-09 A     80200000
10 2020-12-10 A     76600000
# … with 52 more rows
コンマ表記
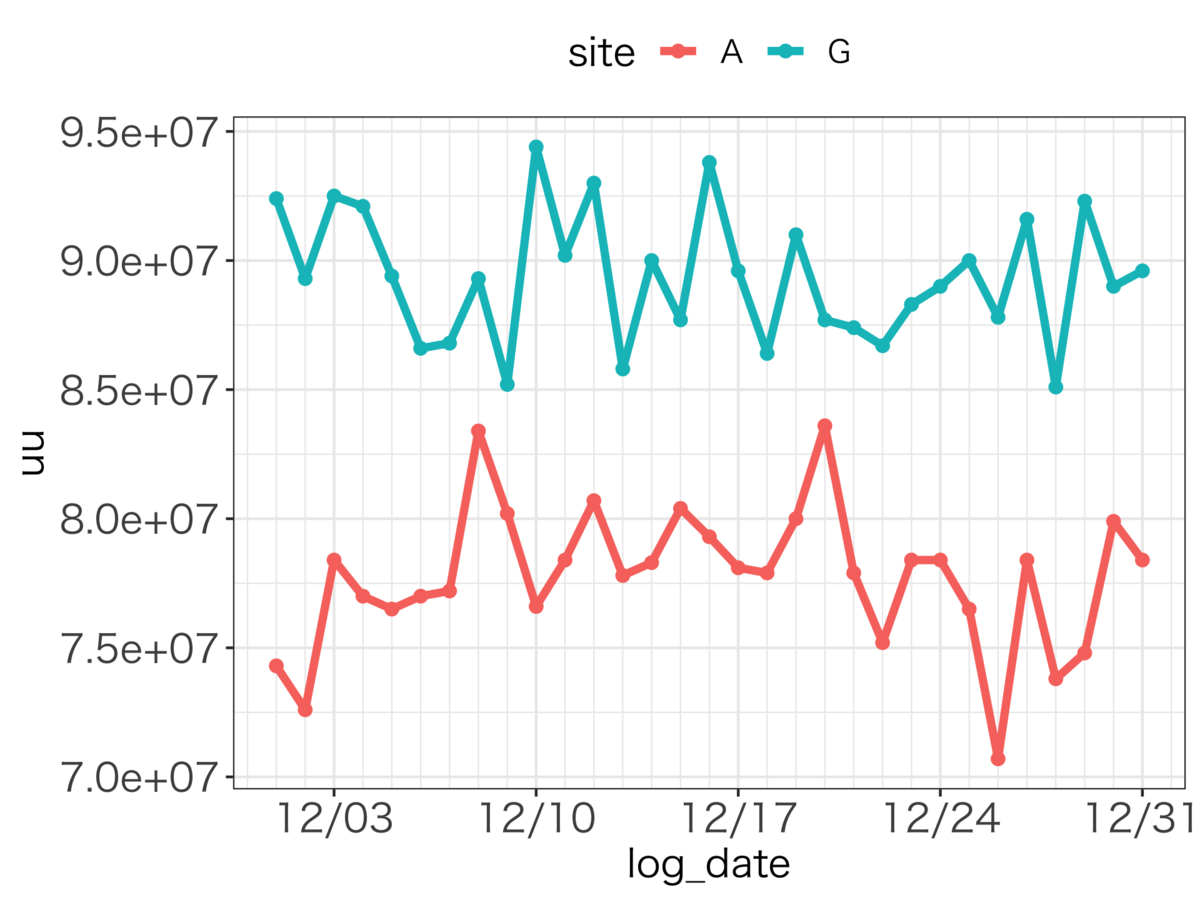
大変大きい数を可視化する場合に起きる問題で、 そのままこのデータを可視化すると、e+07の表記になってしまい、表記に見慣れている人でもすぐに数を把握するのが難しい。
> log_tbl %>%
+     ggplot(aes(x = log_date, y = uu, colour = site)) +
+     geom_line(size = 1.5) +
+     geom_point(size = 2) +
+     scale_x_date(breaks = "7 days", minor_breaks = "1 day",
+                  date_labels = "%m/%d") +
+     theme(legend.position = "top",
+           legend.title = element_text(size = 15),
+           legend.text = element_text(size = 12),
+           axis.title = element_text(size = 15),
+           axis.text = element_text(size = 15))
そこで、コンマ表記にしたい場合は、scale_y_continuous(labels = comma)を追加すれば良い。

パーセント表記
比率を可視化する場合に起きる問題で、ggplot2でfillを指定した場合には0から1の間で表記されてしまう。
こちらは大体見れば分かるが、パーセント表記でやさしくありたい。
> log_tbl %>%
+     ggplot(aes(x = log_date, y = uu, fill = site)) +
+     geom_bar(stat = "identity", position = "fill") +
+     scale_x_date(breaks = "7 days", minor_breaks = "1 day",
+                  date_labels = "%m/%d") +
+     theme(legend.position = "top",
+           legend.title = element_text(size = 15),
+           legend.text = element_text(size = 12),
+           axis.title = element_text(size = 15),
+           axis.text = element_text(size = 15))

ここで、パーセント表記にしたい場合は、scale_y_continuous(labels = percent)を追加すれば良い。

その他
commaもpercentも実態としては、scalesパッケージに含まれている関数で実現している。
他にもラベル表記を簡単に変更することができる。
label_bytes             Label bytes (1 kb, 2 MB, etc)
label_date              Label date/times
label_dollar            Label currencies ($100, $2.50, etc)
label_number            Label numbers in decimal format (e.g. 0.12, 1,234)
label_number_auto       Label numbers, avoiding scientific notation where possible
label_number_si         Label numbers with SI prefixes (2k, 1M, 5T etc)
label_ordinal           Label ordinal numbers (1st, 2nd, 3rd, etc)
label_parse             Label with mathematical annotations
label_percent           Label percentages (2.5%, 50%, etc)
label_pvalue            Label p-values (e.g. <0.001, 0.25, p >= 0.99)
label_scientific        Label numbers with scientific notation (e.g. 1e05, 1.5e-02)
label_wrap              Label strings by wrapping across multiple lines
複数段表記などは使いどころがあるかもしれない。