lubridate::floor_dateで任意の曜日スタートで切り下げ
タイトル通りのメモ。
library(tidyverse)
library(lubridate)

set.seed(12345)
order_tbl <- tibble(
  order_date = seq(ymd("2019-03-01"), ymd("2019-03-31"), by = "1 day"),
  order_num = rpois(31, 5)
)
日曜日と月曜日スタートする場合を追加します。
> order_tbl %>%
+   mutate(wd = weekdays(order_date),
+          sunday_start = floor_date(order_date, unit = "week"),
+          monday_start = floor_date(order_date, unit = "week", week_start = 1))
# A tibble: 31 x 5
   order_date order_num wd     sunday_start monday_start
   <date>         <int> <chr>  <date>       <date>
 1 2019-03-01         6 金曜日 2019-02-24   2019-02-25
 2 2019-03-02         8 土曜日 2019-02-24   2019-02-25
 3 2019-03-03         6 日曜日 2019-03-03   2019-02-25
 4 2019-03-04         8 月曜日 2019-03-03   2019-03-04
 5 2019-03-05         5 火曜日 2019-03-03   2019-03-04
 6 2019-03-06         3 水曜日 2019-03-03   2019-03-04
 7 2019-03-07         4 木曜日 2019-03-03   2019-03-04
 8 2019-03-08         5 金曜日 2019-03-03   2019-03-04
 9 2019-03-09         6 土曜日 2019-03-03   2019-03-04
10 2019-03-10        11 日曜日 2019-03-10   2019-03-04
# … with 21 more rows
つまり、week_start = 1を指定すれば、月曜日スタートで切り下げられます。デフォルトでは、week_start = getOption("lubridate.week.start", 7)が設定されていますので、日曜日スタートになります。
round_dateとcelling_dateを含むfloor_dateの実装場所は以下になります。
github.com
lubridate::rollbackの使い所
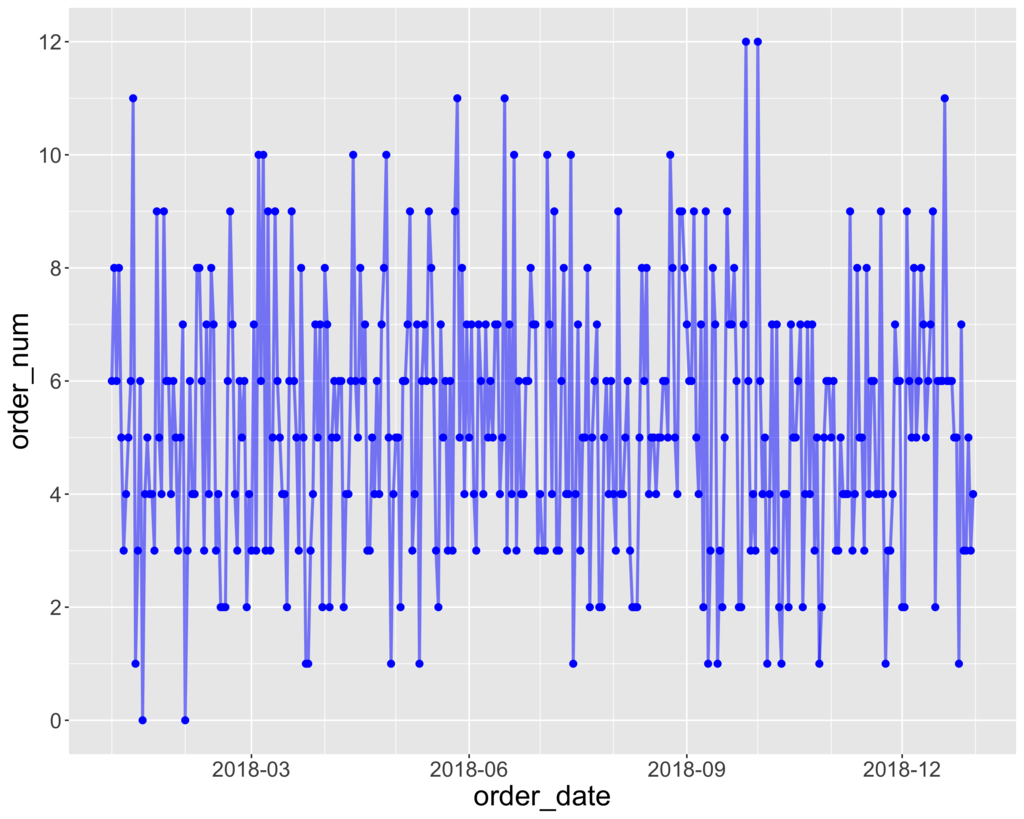
日次データが存在して、その日次データとそれを月ごとにまとめ上げた月次データの可視化を行いたい場合があります。
library(tidyverse)
library(lubridate)

set.seed(12345)
order_tbl <- tibble(
  order_date = seq(ymd("2018-01-01"), ymd("2018-12-31"), by = "1 day"),
  order_num = rpois(365, 5)
)
日次データとしてプロットしたい場合は、以下のようにできます。
order_tbl %>%
  ggplot(aes(x = order_date, y = order_num)) +
  geom_point(size = 2, colour = "blue") +
  geom_line(size = 1, colour = "blue", alpha = 0.5) +
  scale_x_date(date_breaks = "3 months", date_minor_breaks = "1 months", date_labels = "%Y-%m") +
  scale_y_continuous(breaks = seq(0, 20, by = 2), minor_breaks = 1:20) +
  theme(axis.text = element_text(size = 15),
        axis.title = element_text(size = 20))

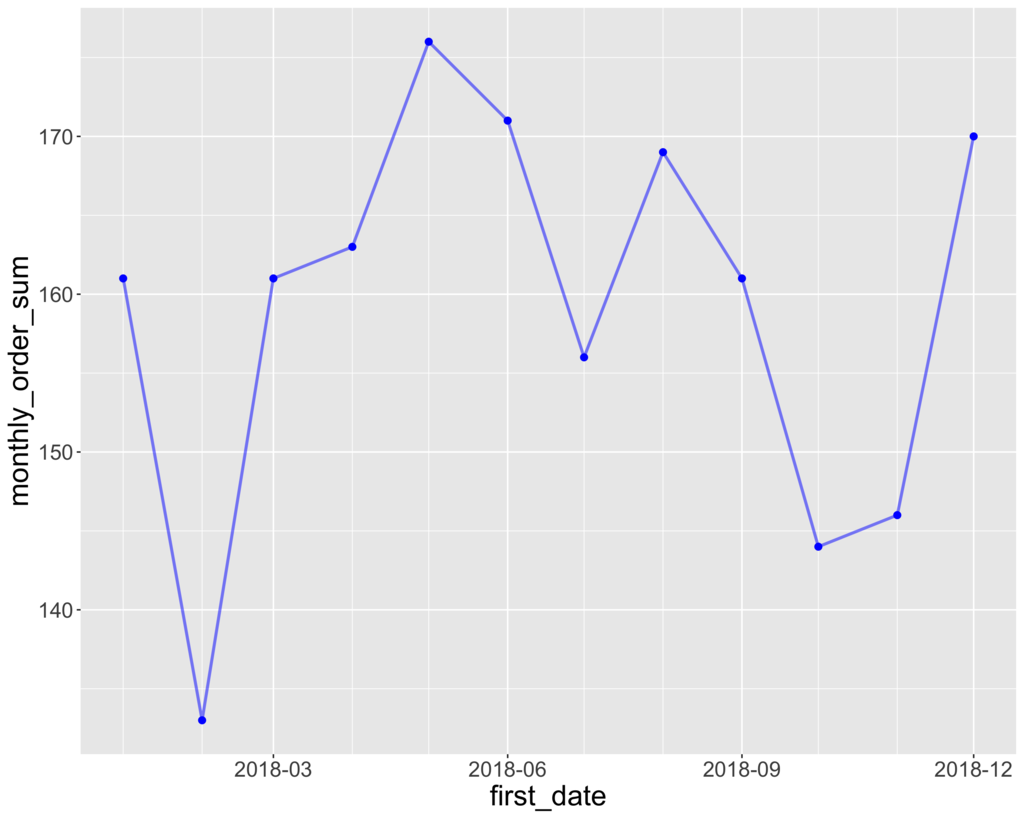
次に、月ごとにまとめ上げたデータは以下のように計算できます (年と月のまとめ上げでも可能)。
order_tbl %>%
  mutate(y = year(order_date),
         m = month(order_date),
         ym = str_c(y, "-", sprintf("%02d", m))) %>%
  group_by(ym) %>%
  summarise(monthly_order_sum = sum(order_num))
#> # A tibble: 12 x 2
#>    ym      monthly_order_sum
#>    <chr>               <int>
#>  1 2018-01               161
#>  2 2018-02               133
#>  3 2018-03               161
#>  4 2018-04               163
#>  5 2018-05               176
#>  6 2018-06               171
#>  7 2018-07               156
#>  8 2018-08               169
#>  9 2018-09               161
#> 10 2018-10               144
#> 11 2018-11               146
#> 12 2018-12               170
しかし、これだと年月を表すカラムがcharactor型のため、上記の日次データを可視化した際に利用したscale_x_dateの部分を流用して同じスケールで可視化できません。
そこで、lubridate::rollbackを利用すれば、以下のようにできます。
order_tbl %>%
  mutate(first_date = rollback(order_date, roll_to_first = TRUE)) %>%
  group_by(first_date) %>%
  summarise(monthly_order_sum = sum(order_num)) %>%
  ggplot(aes(x = first_date, y = monthly_order_sum)) +
  geom_point(size = 2, colour = "blue") +
  geom_line(size = 1, colour = "blue", alpha = 0.5) +
  scale_x_date(date_breaks = "3 months", date_minor_breaks = "1 months", date_labels = "%Y-%m") +
  scale_y_continuous(breaks = seq(0, 200, by = 10), minor_breaks = seq(0, 200, by = 5)) +
  theme(axis.text = element_text(size = 15),
        axis.title = element_text(size = 20))

ここでは、その月の最初の日のカラムを追加して、その日で月次にまとめ上げて可視化しています。こうすることで、日次データで利用したscale_x_dateの部分も流用できます。
rollback関数の中身自体は、day関数を使って、日付部分に1を入れるというシンプルな操作を行う便利関数になっています。
github.com
Rでモデルの評価指標を計算する Metrics
機械学習モデルの分類精度を評価したり、時系列モデルのn期先の予測精度を評価したりする際に、地味に評価指標の計算式をネットで調べて自前でRの関数として実装したりしていました。
しかし、(実際にはよく調べていなかっただけですが、)すでに基本的な指標はパッケージとしてまとめられていました。パッケージ名は、至ってそのままでMetricsパッケージになります。
F1、Rrecision、Recallをはじめ、MAPEやRMSEなど基本的な評価指標は用意されています。
実装はシンプルで、関数に入力する実際の値と予測した値の個数が異なる場合でも、警告メッセージは出ますが値は出力される感じなので、その点は少し注意が必要です。
rvestでUser Agentを偽装する
「偽装する」というと感じが悪いですが、いつも使っているChromeやSafariなどのブラウザで表示される同じ状態をスクレイプしたかったということで、rvestでのユーザーエージェントの変更の仕方を調べたメモ。
結論としては、rvest::html_session(url, ...)の...の部分にセットすれば、httr::GET(url = NULL, config = list(), ..., handle = NULL)のconfigにセットするようになっていました。
library(tidyverse)
library(rvest)
library(httr)

URL <- "http://had.co.nz"
UA <- "Mozilla/5.0 (Macintosh; Intel Mac OS X 10_14_2) AppleWebKit/537.36 (KHTML, like Gecko) Chrome/71.0.3578.98 Safari/537.36"
session <- rvest::html_session(URL, httr::user_agent(UA))
Status CodeとUser Agentを確認します。
> session
<session> http://hadley.nz/
  Status: 200
  Type:   text/html
  Size:   8981

> session$config
<request>
Options:
* useragent: Mozilla/5.0 (Macintosh; Intel Mac OS X 10_14_2) AppleWebKit/537.36 (KHTML, like Gecko) Chrome/71.0.3578.98 Safari/537.36
* autoreferer: 1

> session %>%
+     html_node(xpath = '//*[@id="page-top"]/footer/div/div/div/p/a[2]') %>%
+     html_text(trim = TRUE)
[1] "@hadleywickham"
当然ながら、User Agentだけではなく、httr::set_cookiesを利用すれば、Cookieもセットすることができます。
COOKIE1 <- "www"
COOKIE2 <- "zzz"
session <- rvest::html_session(URL, httr::user_agent(UA), httr::set_cookies(w = COOKIE1, z = COOKIE2))
以下のように、Cookie部分が追加されていることが確認できます。
> session$config
<request>
Options:
* useragent: Mozilla/5.0 (Macintosh; Intel Mac OS X 10_14_2) AppleWebKit/537.36 (KHTML, like Gecko) Chrome/71.0.3578.98 Safari/537.36
* cookie: w=www;z=zzz
* autoreferer: 1
html_sessionの実装場所は以下になります。
github.com
ggplot2で値の正負によって、色分けする
データの値の正負によって色分けをしたい場合があります。この場合、mutateでTRUE/FALSEの判定をした新しいカラムを追加して可視化するということをよくしていましたが、データが大変多い場合などには、可視化の色分けのためだけにカラムを追加するということはあまりしたくありません。
ggplotの中でなんとかできないか調べていたら、aesの中で比較演算子を使って簡単に色分けができる。ということを今さら知ったので、メモします。
library(tidyverse)

sample_tbl <- tibble(
  type = LETTERS,
  value = runif(length(LETTERS), -1, 1)
)

sample_tbl %>%
  ggplot(aes(x = type, y = value, fill = value > 0)) +
  geom_bar(stat = "identity") +
  labs(x = "", y = "") + theme_bw() +
  theme(axis.text = element_text(size = 20),
        legend.position = "none")
value > 0を指定するだけでした...

加えて、こちらはよく調べられていると思われる昇順、降順で並べ替えてのプロットですが、reorderを使ってすぐにできます。
sample_tbl %>%
  ggplot(aes(x = reorder(type, value), y = value, fill = value > 0)) +
  geom_bar(stat = "identity") +
  labs(x = "", y = "") + theme_bw() +
  theme(axis.text = element_text(size = 20),
        legend.position = "none")

lubridateのweekとisoweekの違い
日次データを週次データとして売り上げなどをまとめて集計したいということはよくあります。今まで特に何も気にすることなく、lubridateのisoweekを使って週番号を付けて集計していましたが、年を跨いだ場合にどのような週番号が付くのかを確認したのでメモします。
ここでは、年を跨いだ16日分の日次データがあったとします。
> library(tidyverse)
> library(lubridate)

> sample_tbl <- tibble(
+   date = seq(as.Date("2018-12-23"), as.Date("2019-01-07"), by = 1),
+   sales = sample(1:100, 16)
+ )
> sample_tbl
# A tibble: 16 x 2
   date       sales
   <date>     <int>
 1 2018-12-23    19
 2 2018-12-24    68
 3 2018-12-25    37
 4 2018-12-26    36
 5 2018-12-27    84
 6 2018-12-28    86
 7 2018-12-29    59
 8 2018-12-30    13
 9 2018-12-31    72
10 2019-01-01    40
11 2019-01-02    96
12 2019-01-03    69
13 2019-01-04    23
14 2019-01-05    28
15 2019-01-06     6
16 2019-01-07     4
これに対して、それぞれの週番号と曜日を追加します。
> sample_tbl %>%
+     mutate(week = week(date)) %>%
+     mutate(isoweek = isoweek(date)) %>%
+     mutate(epiweek = epiweek(date)) %>%
+     mutate(weekdays = weekdays(date))
# A tibble: 16 x 6
   date       sales  week isoweek epiweek weekdays
   <date>     <int> <dbl>   <dbl>   <dbl> <chr>
 1 2018-12-23    73    51      51      52 日曜日
 2 2018-12-24    87    52      52      52 月曜日
 3 2018-12-25    75    52      52      52 火曜日
 4 2018-12-26    86    52      52      52 水曜日
 5 2018-12-27    44    52      52      52 木曜日
 6 2018-12-28    16    52      52      52 金曜日
 7 2018-12-29    31    52      52      52 土曜日
 8 2018-12-30    48    52      52       1 日曜日
 9 2018-12-31    67    53       1       1 月曜日
10 2019-01-01    91     1       1       1 火曜日
11 2019-01-02     4     1       1       1 水曜日
12 2019-01-03    14     1       1       1 木曜日
13 2019-01-04    65     1       1       1 金曜日
14 2019-01-05     1     1       1       1 土曜日
15 2019-01-06    34     1       1       2 日曜日
16 2019-01-07    40     1       2       2 月曜日
つまり、weekは1月1日からスタートで週番号を付けるので、53週目が存在します。一方、isoweekはISO 8601規格で「年の最初の木曜日を含む週が、その年の第1週」として週番号を付けるので、2018年12月31日も1週目となります(2017年などは年を越しても1月1日は52週目となります)。
大抵のビジネスシーンでは、月曜始まりの7日間の売り上げを週次データとして集計するので、isoweekを使うことになると思います。
おまけとして、epiweekというものもあり、こちらは日曜日を週の始まりとした週番号になります。
RでFashion MNISTメモ シンプルなCNN
RでFashion MNISTの続き。前回の全結合モデルでは、正解率9割届かずという結果でした。今回は畳み込みニューラルネットを用いることで、それらの正解率が向上するか確認します。
データ準備
前回同様、まずは畳み込みニューラルネットで読み込む形にデータを変換します。
library(keras)
library(tidyverse)

fashion_mnist <- dataset_fashion_mnist()
c(c(train_images, train_labels), c(test_images, test_labels)) %<-% fashion_mnist

train_images = array_reshape(train_images, c(nrow(train_images), 28, 28, 1)) / 255
test_images = array_reshape(test_images, c(nrow(test_images), 28, 28, 1)) / 255
train_labels = to_categorical(train_labels, 10)
test_labels = to_categorical(test_labels, 10)
今回は、(28, 28, 1)というサイズが入力になります。
モデル定義
畳み込み層のフィルタ数を変更した、2つのモデルを定義します。
cnn_model1 <- keras_model_sequential() %>%
  layer_conv_2d(filters = 32, kernel_size = c(3, 3),
                activation = "relu", input_shape = c(28, 28, 1)) %>%
  layer_max_pooling_2d(pool_size = c(2, 2)) %>%
  layer_conv_2d(filters = 64, kernel_size = c(3, 3),
                activation = "relu") %>%
  layer_max_pooling_2d(pool_size = c(2, 2)) %>%
  layer_conv_2d(filters = 64, kernel_size = c(3, 3),
                activation = "relu") %>%
  layer_max_pooling_2d(pool_size = c(2, 2)) %>%
  layer_flatten() %>%
  layer_dropout(rate = 0.5) %>%
  layer_dense(units = 64, activation = "relu") %>%
  layer_dense(units = 10, activation = "softmax")

cnn_model2 <- keras_model_sequential() %>%
  layer_conv_2d(filters = 64, kernel_size = c(3, 3),
                activation = "relu", input_shape = c(28, 28, 1)) %>%
  layer_max_pooling_2d(pool_size = c(2, 2)) %>%
  layer_conv_2d(filters = 128, kernel_size = c(3, 3),
                activation = "relu") %>%
  layer_max_pooling_2d(pool_size = c(2, 2)) %>%
  layer_conv_2d(filters = 128, kernel_size = c(3, 3),
                activation = "relu") %>%
  layer_max_pooling_2d(pool_size = c(2, 2)) %>%
  layer_flatten() %>%
  layer_dropout(rate = 0.5) %>%
  layer_dense(units = 128, activation = "relu") %>%
  layer_dense(units = 10, activation = "softmax")
定義したモデルの中身を確認します。
> cnn_model1
#> Model
#> _______________________________________________________________
#> Layer (type)                Output Shape             Param #
#> ===============================================================
#> conv2d_1 (Conv2D)           (None, 26, 26, 32)       320
#> _______________________________________________________________
#> max_pooling2d_1 (MaxPooling (None, 13, 13, 32)       0
#> _______________________________________________________________
#> conv2d_2 (Conv2D)           (None, 11, 11, 64)       18496
#> _______________________________________________________________
#> max_pooling2d_2 (MaxPooling (None, 5, 5, 64)         0
#> _______________________________________________________________
#> conv2d_3 (Conv2D)           (None, 3, 3, 64)         36928
#> _______________________________________________________________
#> flatten_1 (Flatten)         (None, 576)              0
#> _______________________________________________________________
#> dropout_1 (Dropout)         (None, 576)              0
#> _______________________________________________________________
#> dense_1 (Dense)             (None, 64)               36928
#> _______________________________________________________________
#> dense_2 (Dense)             (None, 10)               650
#> ===============================================================
#> Total params: 93,322
#> Trainable params: 93,322
#> Non-trainable params: 0
#> _______________________________________________________________

> cnn_model2
#> Model
#> _______________________________________________________________
#> Layer (type)                Output Shape             Param #
#> ===============================================================
#> conv2d_4 (Conv2D)           (None, 26, 26, 64)       640
#> _______________________________________________________________
#> max_pooling2d_3 (MaxPooling (None, 13, 13, 64)       0
#> _______________________________________________________________
#> conv2d_5 (Conv2D)           (None, 11, 11, 128)      73856
#> _______________________________________________________________
#> max_pooling2d_4 (MaxPooling (None, 5, 5, 128)        0
#> _______________________________________________________________
#> conv2d_6 (Conv2D)           (None, 3, 3, 128)        147584
#> _______________________________________________________________
#> flatten_2 (Flatten)         (None, 1152)             0
#> _______________________________________________________________
#> dropout_2 (Dropout)         (None, 1152)             0
#> _______________________________________________________________
#> dense_3 (Dense)             (None, 128)              147584
#> _______________________________________________________________
#> dense_4 (Dense)             (None, 10)               1290
#> ===============================================================
#> Total params: 370,954
#> Trainable params: 370,954
#> Non-trainable params: 0
#> _______________________________________________________________
学習・検証
前回作成したfit_model関数に上記で定義したモデルを流します。
CPUではこれらの実行には少々時間がかかるため、注意が必要です。
result_cnn_model1 <- fit_model(cnn_model1, epochs = 10)
result_cnn_model2 <- fit_model(cnn_model2, epochs = 10)
実行が終わったら、それぞれの学習の推移をプロットして確認します。
plot(result_cnn_model1$history)

plot(result_cnn_model2$history)

評価
テストセットに対する損失と精度を確認します。
> result_cnn_model1$evaluate$loss
#> [1] 0.2751199
> result_cnn_model2$evaluate$loss
#> [1] 0.2569514

> result_cnn_model1$evaluate$acc
#> [1] 0.904
> result_cnn_model2$evaluate$acc
#> [1] 0.9166
どちらのモデルでも9割を超える正答率になりました。 それぞれのファッションアイテムごとの正解率についても計算します。
> predict_labels <- result_cnn_model1$model %>%
+   predict_classes(test_images)
> table(fashion_mnist$test$y, predict_labels)
#>    predict_labels
#>       0   1   2   3   4   5   6   7   8   9
#>   0 930   1  14  13   4   3  29   0   6   0
#>   1   2 981   0  12   3   0   0   0   2   0
#>   2  23   1 852  12  54   0  56   0   2   0
#>   3  26   5   9 915  20   0  21   0   4   0
#>   4   2   1  43  31 868   0  53   0   2   0
#>  5   0   0   0   0   0 966   0  25   0   9
#>   6 195   2  62  24  83   0 616   0  18   0
#>   7   0   0   0   0   0   4   0 984   0  12
#>   8   4   0   1   3   2   4   2   6 978   0
#>   9   0   0   0   0   0   5   0  45   0 950
> diag(table(fashion_mnist$test$y, predict_labels)) / table(fashion_mnist$test$y)
#>
#>     0     1     2     3     4     5     6     7     8     9
#> 0.930 0.981 0.852 0.915 0.868 0.966 0.616 0.984 0.978 0.950
>
> predict_labels <- result_cnn_model2$model %>%
+   predict_classes(test_images)
> table(fashion_mnist$test$y, predict_labels)
#>    predict_labels
#>       0   1   2   3   4   5   6   7   8   9
#>   0 910   1  23  14   4   1  42   0   5   0
#>   1   0 983   1  14   0   0   0   0   2   0
#>   2  16   2 880   8  43   0  50   0   1   0
#>   3  14   8  10 924  20   0  23   0   1   0
#>   4   0   0  44  23 881   0  49   0   3   0
#>   5   0   0   0   0   0 978   0  11   0  11
#>   6 150   2  61  27  62   0 689   0   9   0
#>   7   0   0   0   0   0   4   0 975   0  21
#>   8   4   1   2   4   3   1   1   2 982   0
#>   9   0   0   1   0   0   4   0  31   0 964
> diag(table(fashion_mnist$test$y, predict_labels)) / table(fashion_mnist$test$y)
#>
#>    0     1     2     3     4     5     6     7     8     9
#> 0.910 0.983 0.880 0.924 0.881 0.978 0.689 0.975 0.982 0.964
全結合モデルでは、2のPulloverや4のCoatは7割5分程度の正解率であったものが、8割5分を越えるまでに大きく上昇していることが確認できました。

